This guide walks you through installing the OpsRamp Kubernetes 2.0 Agent on your Kubernetes cluster. To proceed with installation, follow the below steps:
Step 1: Configure the Kubernetes 2.0 Integration
A. Add the Integration
- In the OpsRamp portal, select your client:
- Navigate to All Clients, then click the Client/Partner dropdown.
- Search for your client name or select it from the list.
- Navigate to Setup > Account > Integration.
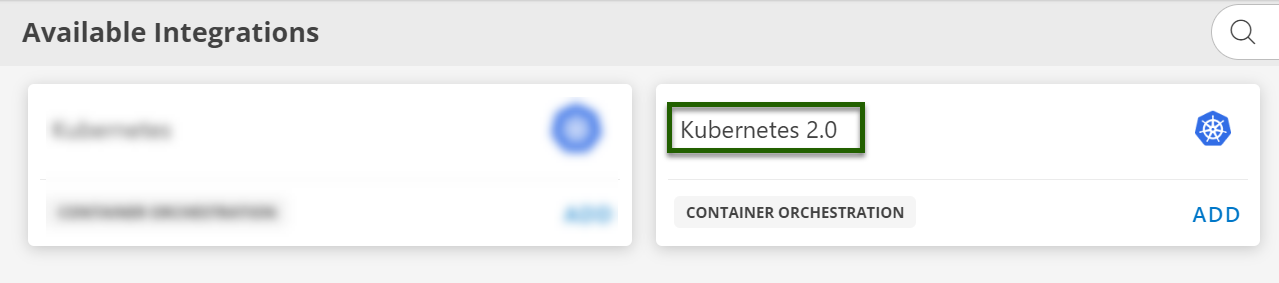
- If you have no installed apps, you’ll land on the Available Integrations page.
- If you have installed apps, click + ADD to open the Available Integrations list.
- Search for Kubernetes 2.0.
- Click ADD and select the latest integration version.
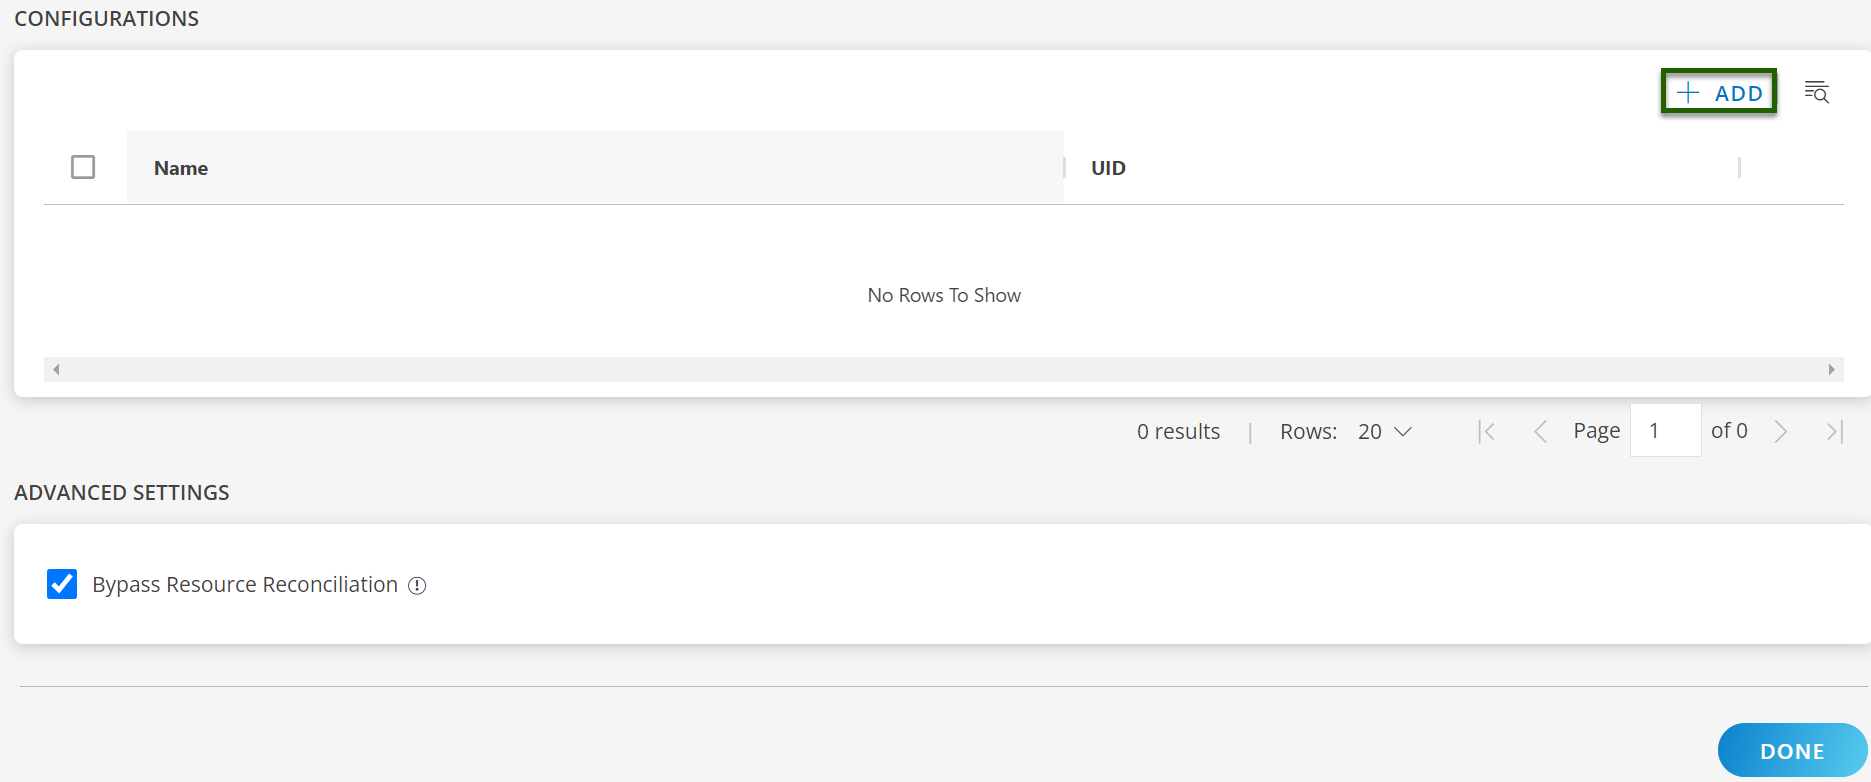
B. Create a Configuration
- On the configuration page, click + ADD.
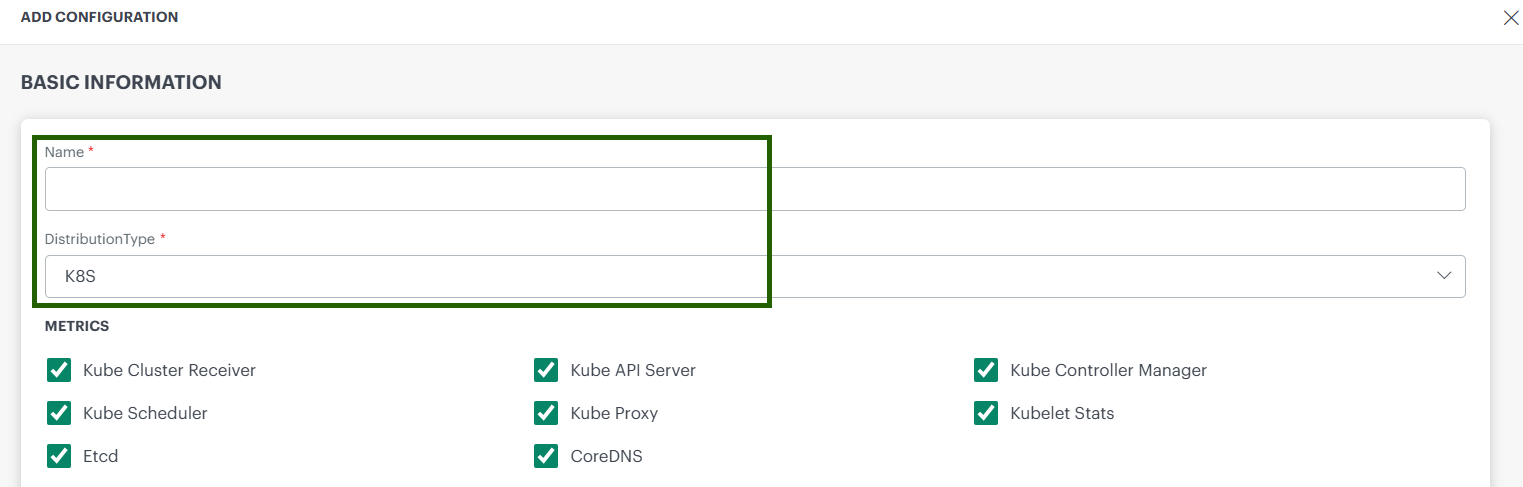
- Fill in the Basic Information:
- Name: Friendly name for the cluster.
- Distribution Type: Select one of the following:
K8S / EKS / AKS / GKE / K3S / MicroK8s / RKE2 / OKD
C. Enable Additional Features (optional)
Enable the floowing supported feature you can enable during the installation of kubernetes Agent:
- Metrics: Choose the required Infrastructure Metric based on your monitoring needs.
- Kube-Events: Enable/disable Kubernetes event collection.
- Logs : Enable log collection from the cluster.
- Traces : Enable tracing and set tracing-proxy replica count.
- Host Network Analytics : Enables deep, real-time insights into network activity across your Kubernetes 2.0 clusters. Ensure you select your container engine from the drop-down list before proceeding.
Note
These features can be enabled either during a new installation of the Kubernetes 2.0 agent or by editing the configuration of an existing installation.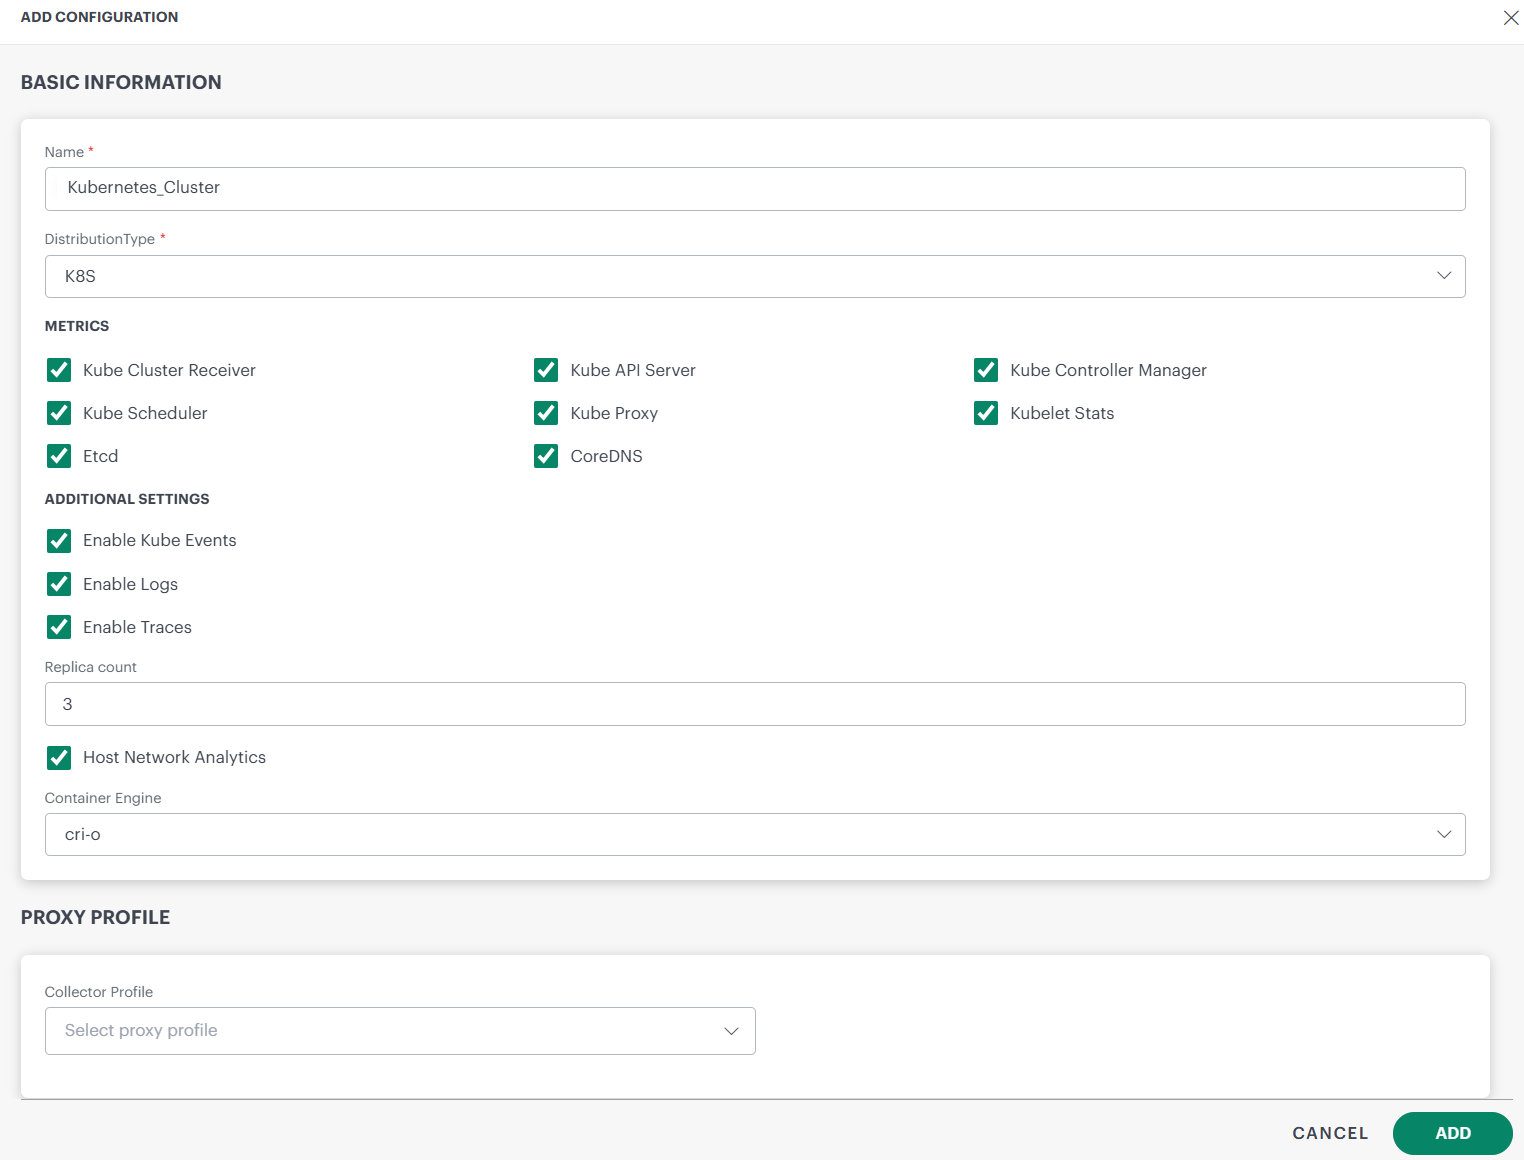
D. Proxy Settings (if required)
- Select the appropriate Collector Profile from the dropdown menu.
- The system will automatically fill in the corresponding IP address based on your selection.
- This setup ensures that the proxy is correctly configured to support Kubernetes 2.0 operations.
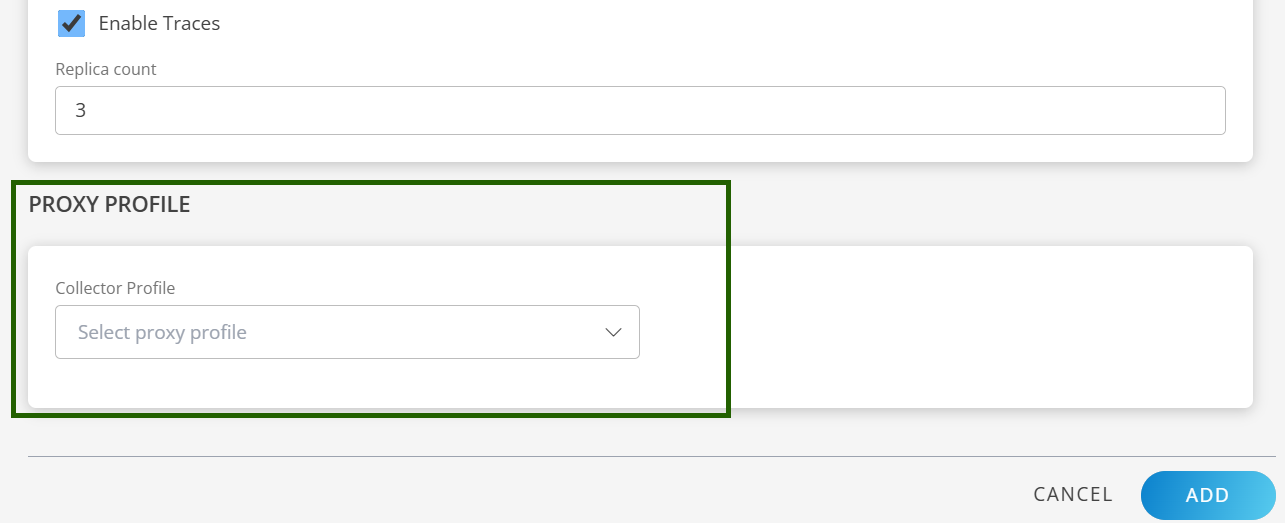
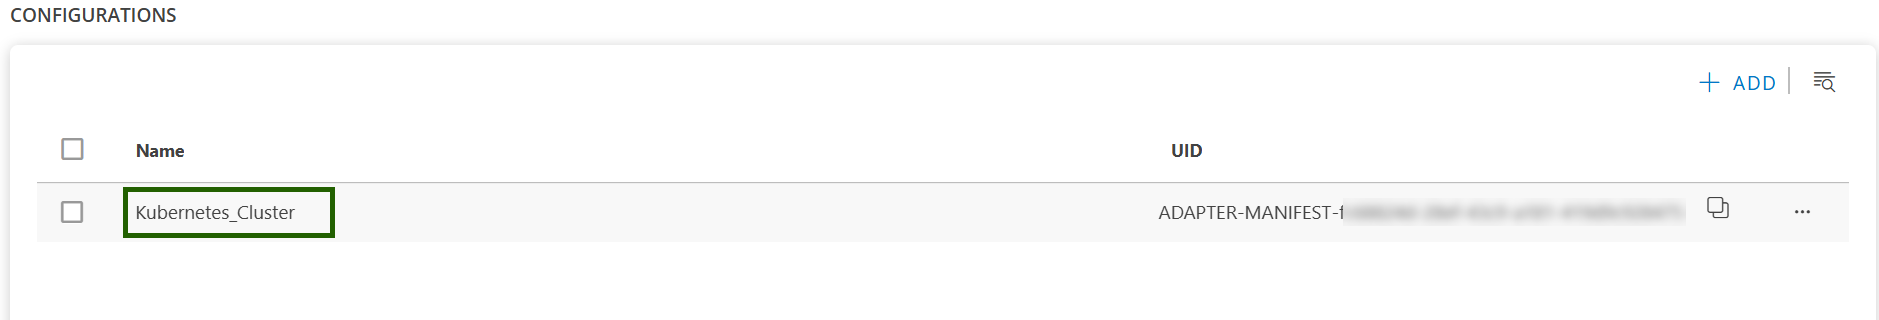
E. Save the Configuration
- Click ADD to save the configuration.
- Your new configuration appears on the Configuration home page.
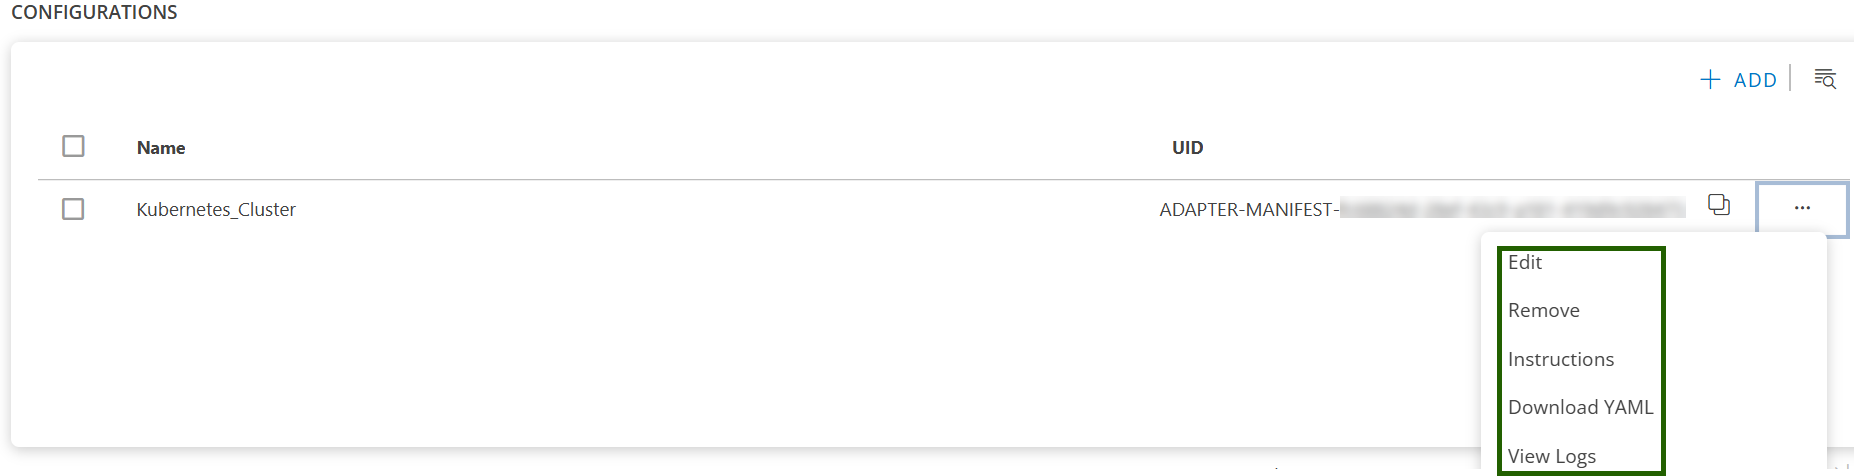
F. Manage the Configuration (Optional)
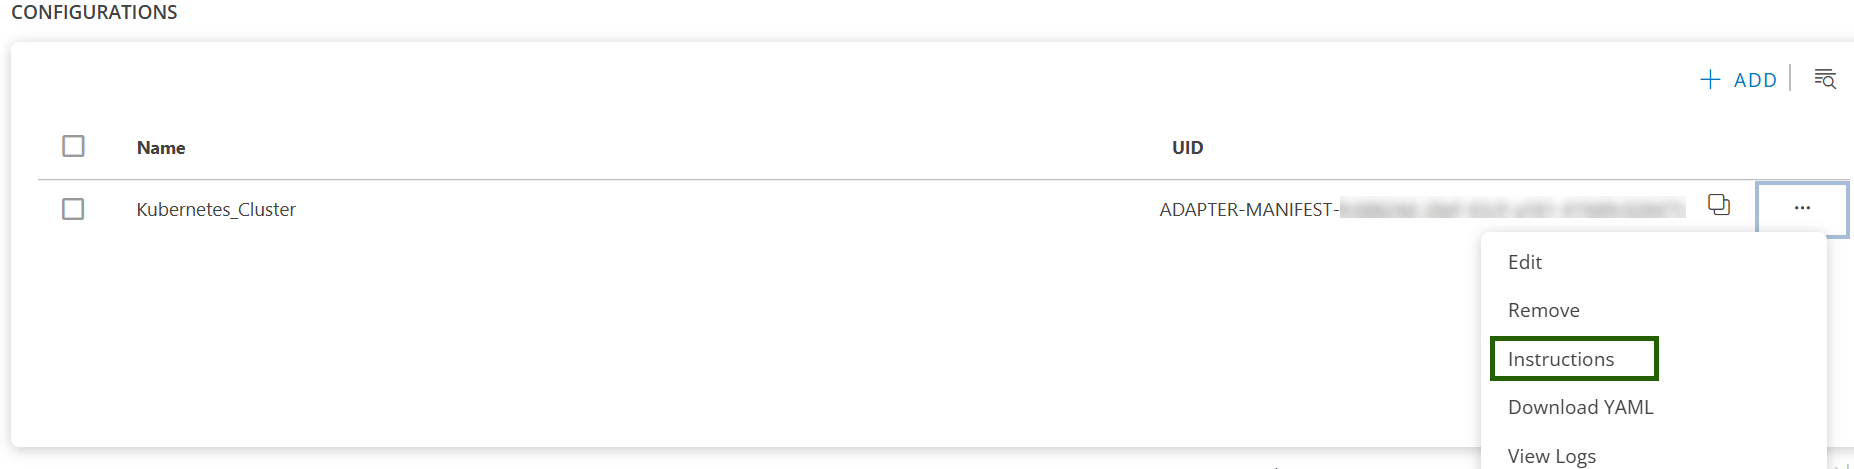
Once the configuration is created, click the ellipsis ( … ) next to the configuration to:
- Edit: Update the existing configuration, such as the distribution type or enable/disable supported features.
- Remove: Delete the configuration and related resources.
- Instruction: View the installation instructions for the selected configuration.
- Download YAML: Download the configuration YAML file.
- View Logs: View the collected logs for the configuration.
Tip
Each configuration is for one cluster. To add another cluster, click + ADD again.Step 2: Get the YAML Configuration File
You can either download the file or copy its contents.
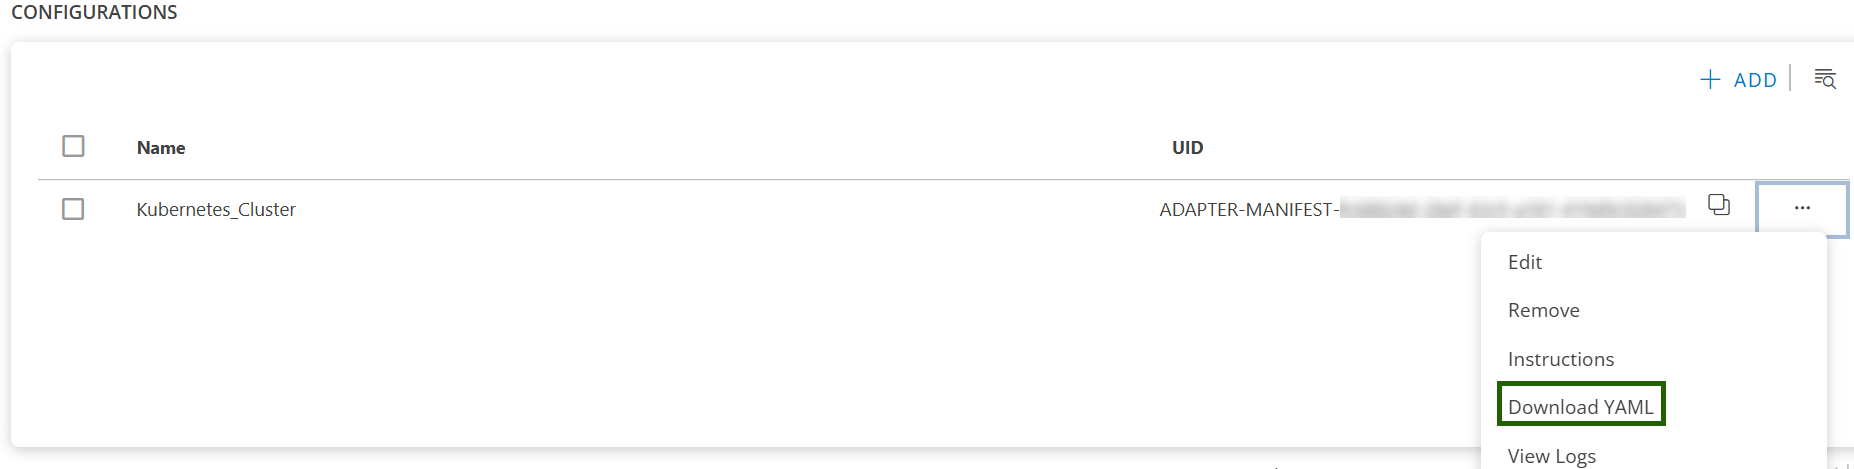
Option 1: Download
- Click the ellipsis ( … ) next to the configuration.
- Select Download YAML.
- The file (e.g.,
opsramp-agent-values.yaml) will be saved to your local system.
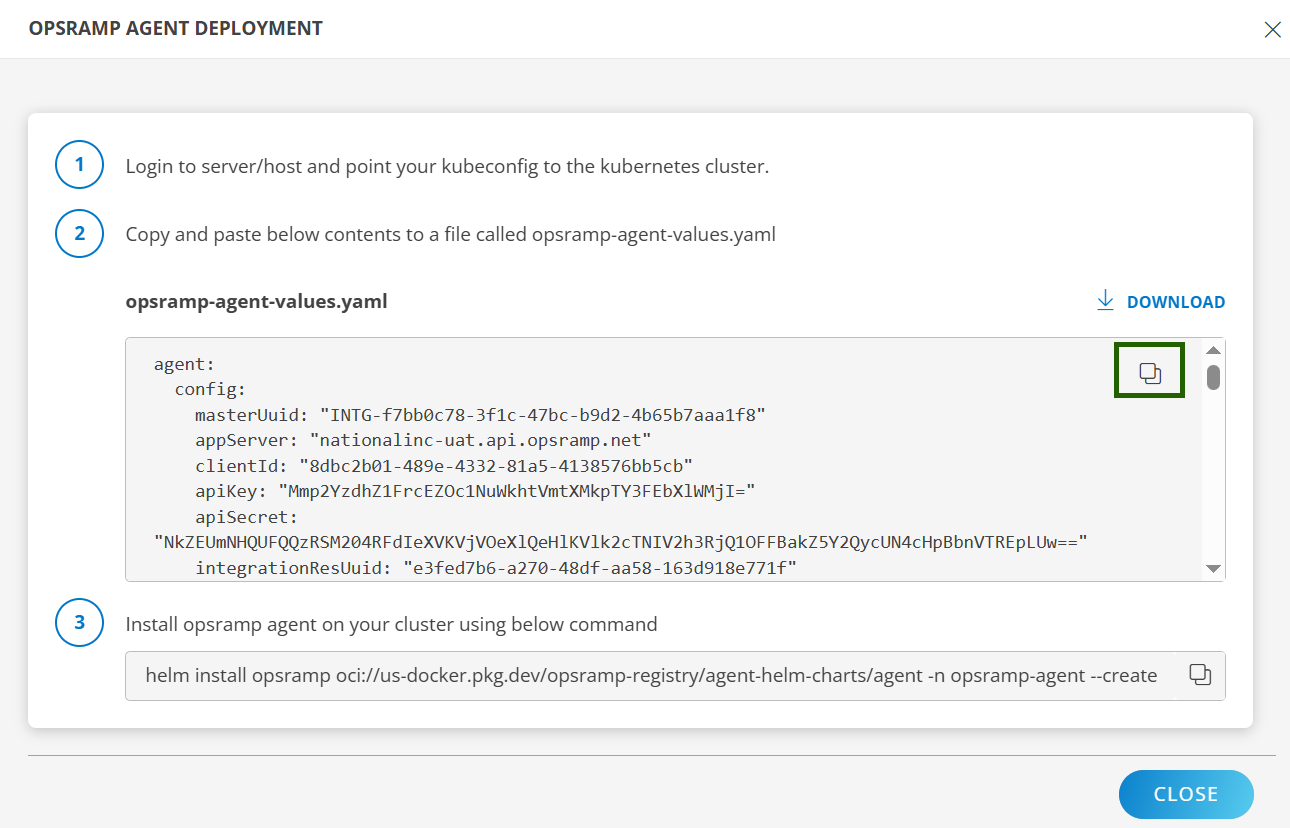
Option 2: Copy
- Click the ellipsis ( … ) next to the configuration.
- Select Instructions.
- Click Copy to copy the YAML content.
- Paste the content into a file named
opsramp-agent-values.yaml.
Sample YAML file:
agent:
  config:
    masterUuid: "INTG-<integration UUID>"
    appServer: "OpsRamp API app server https endpoint"
    clientId: "<some client ID>"
    apiKey: "<api-key>"
    apiSecret: "<api-secret>"
    integrationResUuid: "e66995e3-5864-4807-89f9-97330f45a0d0"
    kubernetesType: "<type-of-k8s-distro>"
    enableLogManagement: "TRUE"
    clusterUuid: "<cluster-UUID>"
    clusterName: "<name-of-the-cluster-you-have-given>"
    appConfigId: "ADAPTER-MANIFEST-<app-Config-ID>"
    sdkAppName: "Kubernetes-2.0"
    metricEndpoint: "OpsRamp metric https endpoint"
    metricAuthTokenUrl: "OpsRamp Metric Auth https endpoint"
    logLevel: "warn"
    connectionType: "direct"
    proxy:
      server: ""
      port: null
      protocol: ""
      username: ""
      password: ""

metrics:
  kubeCluster:
    enabled: true
  kubeApiServer:
    enabled: true
  kubeControllerManager:
    enabled: true
  kubeScheduler:
    enabled: true
  kubelet:
    enabled: true
  kubeletStats:
    enabled: true
  kubeProxy:
    enabled: true
  coreDNS:
    enabled: true
  etcd:
    enabled: true
  cAdvisor:
    enabled: true

logs:
  enabled: false
  endPoint: "OpsRamp Logs https endpoint"

kubeEvents:
  enabled: true

traces:
  enabled: true

ebpf:
  enabled: true
  logEndpoint: "OpsRamp https endpoint"

trace-proxy:
  replicaCount: 3
  config:
    OpsrampAPI: "OpsRamp https endpoint"
    AuthConfiguration:
      Endpoint: "OpsRamp auth endpoint"
      Key: "Auth Key"
      Secret: "Auth Secret"
      TenantId: "Tenant ID"
    LogsEndpoint: "OpsRamp Logs https endpoint"
    MetricsConfig:
      Enable: true
      OpsRampAPI: "OpsRamp Metrics https endpoint"
Step 3: Install the Kubernetes 2.0 Agent (Helm)
- Log in to your server or host with
kubectlaccess to your cluster. - Ensure your
kubeconfigis pointing to the correct cluster. - Run the Helm install command using your YAML file path:
helm install opsramp oci://us-docker.pkg.dev/opsramp-registry/agent-helm-charts/agent -n opsramp-agent --create-namespace --values <download-file-path-or-copied-file-path>.yamlNote
The above command is compatible with Helm version 3.2.0 and later.Step 4: Validate the Deployment
A. Check namespace & pods
kubectl get ns opsramp-agent
kubectl get pods -n opsramp-agent
B. Check Helm release
helm list -n opsramp-agentC. Check logs (spot check a pod)
kubectl logs -n opsramp-agent deploy/opsramp-agent --tail=200D. Verify data in OpsRamp
- In the OpsRamp portal, confirm the cluster/resource and metrics are arriving for the receivers you enabled.
- If enabled, confirm Logs, Kube-Events, and Traces are visible.
Note
When installing the OpsRamp Kubernetes 2.0 Agent on OKD / OpenShift Enterprise clusters, you may see Kubernetes PodSecurity Admission (PSA) warnings during the Helm installation process.
These warnings are informational only and do not affect the installation or runtime behavior of the OpsRamp Agent. They can be safely ignored.
Common warnings may include:
- Violation of PodSecurity
"profile restricted:latest" - Host namespaces enabled (
hostNetwork=true,hostPID=true) runAsNonRootset to false
These settings are intentional and required. The OpsRamp Agent runs with elevated privileges to enable direct host access, which is necessary to collect:
- Node‑level metrics
- Logs
- Container runtime data
- System information
- etcd certificates
Troubleshooting
If you encounter installation issues, see the Troubleshooting documentation.